
Check SMM Silicon Product Prices
Order to View Historical Spot Metal Price Trends by SMM
SMM March 21 News:
In February 2025, China's PV glass exports were 282,100 mt, down 9.41% YoY and 28.04% MoM. For January-February 2025, the export volume was 674,100 mt, a slight decrease of 0.07% YoY. The largest trade flow in February was to India, at 98,600 mt, down 33.29% MoM. Due to the Chinese New Year break and the suspension of logistics, the export volume dropped sharply. Although some overseas demand improved, the overall volume still decreased. Vietnam's trade volume rose to second place, with 43,400 mt, up 28.02% MoM.
Figure 1: China's PV Glass Exports in February 2025
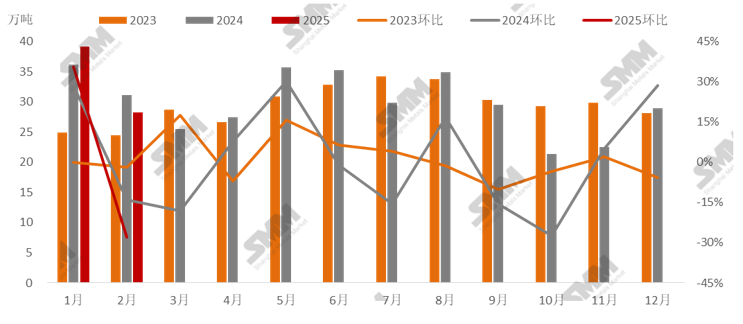
Data Source: General Administration of Customs, SMM
The top 5 export destinations in February were India, Vietnam, US, Thailand, and Indonesia. Vietnam's demand rose to second place, increasing 28.02% MoM from January. The top 5 trading partners accounted for 80.73% of total exports, up nearly 5 percentage points from January, indicating a further increase in the concentration of domestic glass exports.
Figure 2: Statistics on China's PV Glass Exports in February 2025 (by Trading Partner)
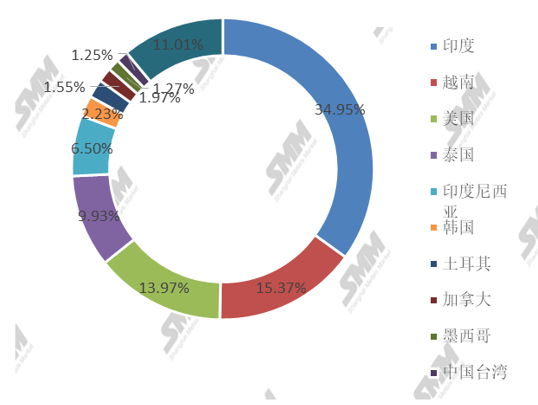
Data Source: General Administration of Customs, SMM
Compared to January, China's exports to India were 98,600 mt, down 33.29% MoM, accounting for 34.95% of total exports; to Vietnam, 43,400 mt, up 28.02% MoM, accounting for 15.37%; to the US, 39,400 mt, down 46.17% MoM, accounting for 13.97%; to Thailand, 28,000 mt, up 117.05% MoM, accounting for 9.93%, rising to fourth place; to Indonesia, 18,300 mt, down 36.01% MoM, falling to fifth place; to South Korea, 6,300 mt, down 38.24% MoM, accounting for 2.23%, rising to fifth place.

![[SMM PV News] Armenia Hits 1.1 GW Solar Capacity,](https://imgqn.smm.cn/usercenter/qQwIB20251217171741.jpg)
![Spot Market and Domestic Inventory Brief Review (February 5, 2026) [SMM Silver Market Weekly Review]](https://imgqn.smm.cn/usercenter/tSwaX20251217171735.jpg)